
The detection experiment
Finding individual crowns
Compare the models, inspect crowns in the aerial images and see how the study measured success.
CATCH4D Upscaling · Troisdorf
Municipal tree registers mainly document trees managed by local authorities. Trees on private land and some other woody vegetation may be absent from these records.
The original study, Victoria Luise Pissulla’s master’s thesis at Ruhr University Bochum, used open RGB orthophotos and airborne LiDAR data to map tree-like vegetation in Troisdorf’s settlement areas and estimate crown height and geometric volume. CATCH4D Upscaling then tested whether LiDAR-derived height could also improve detection of individual crowns, especially where neighbouring crowns touch.
Follow the story ↓
The starting point
A register is built for managing particular trees. A wider vegetation inventory asks a different question: what is growing across the settlement, including on private land? Even the boundary between a tree and a shrub can affect what a register includes.
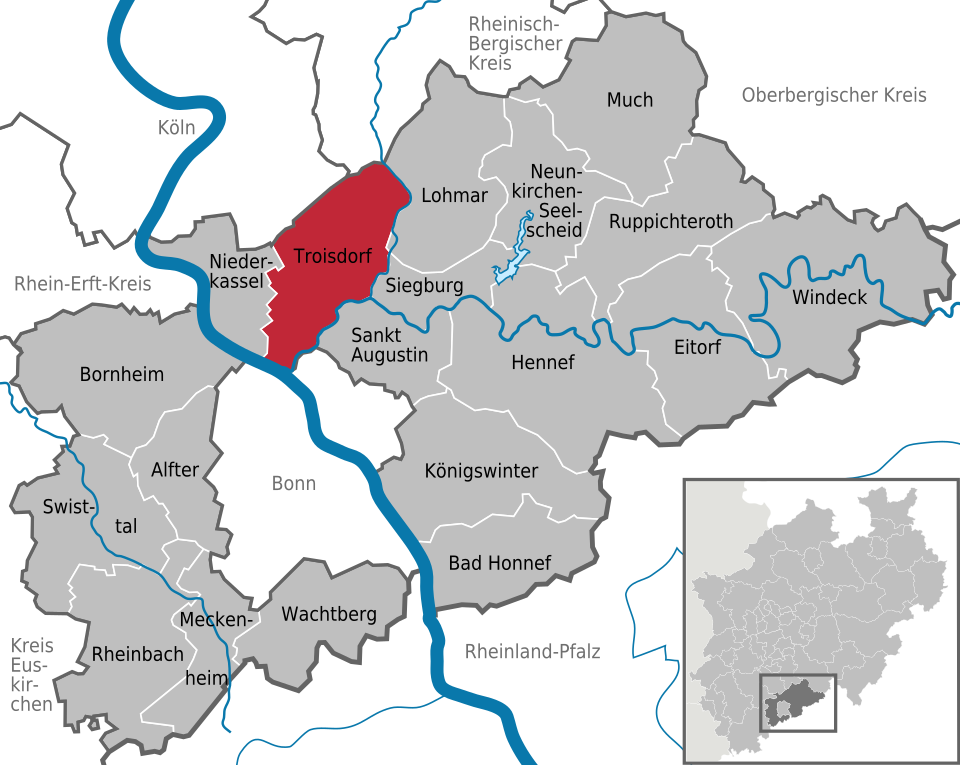
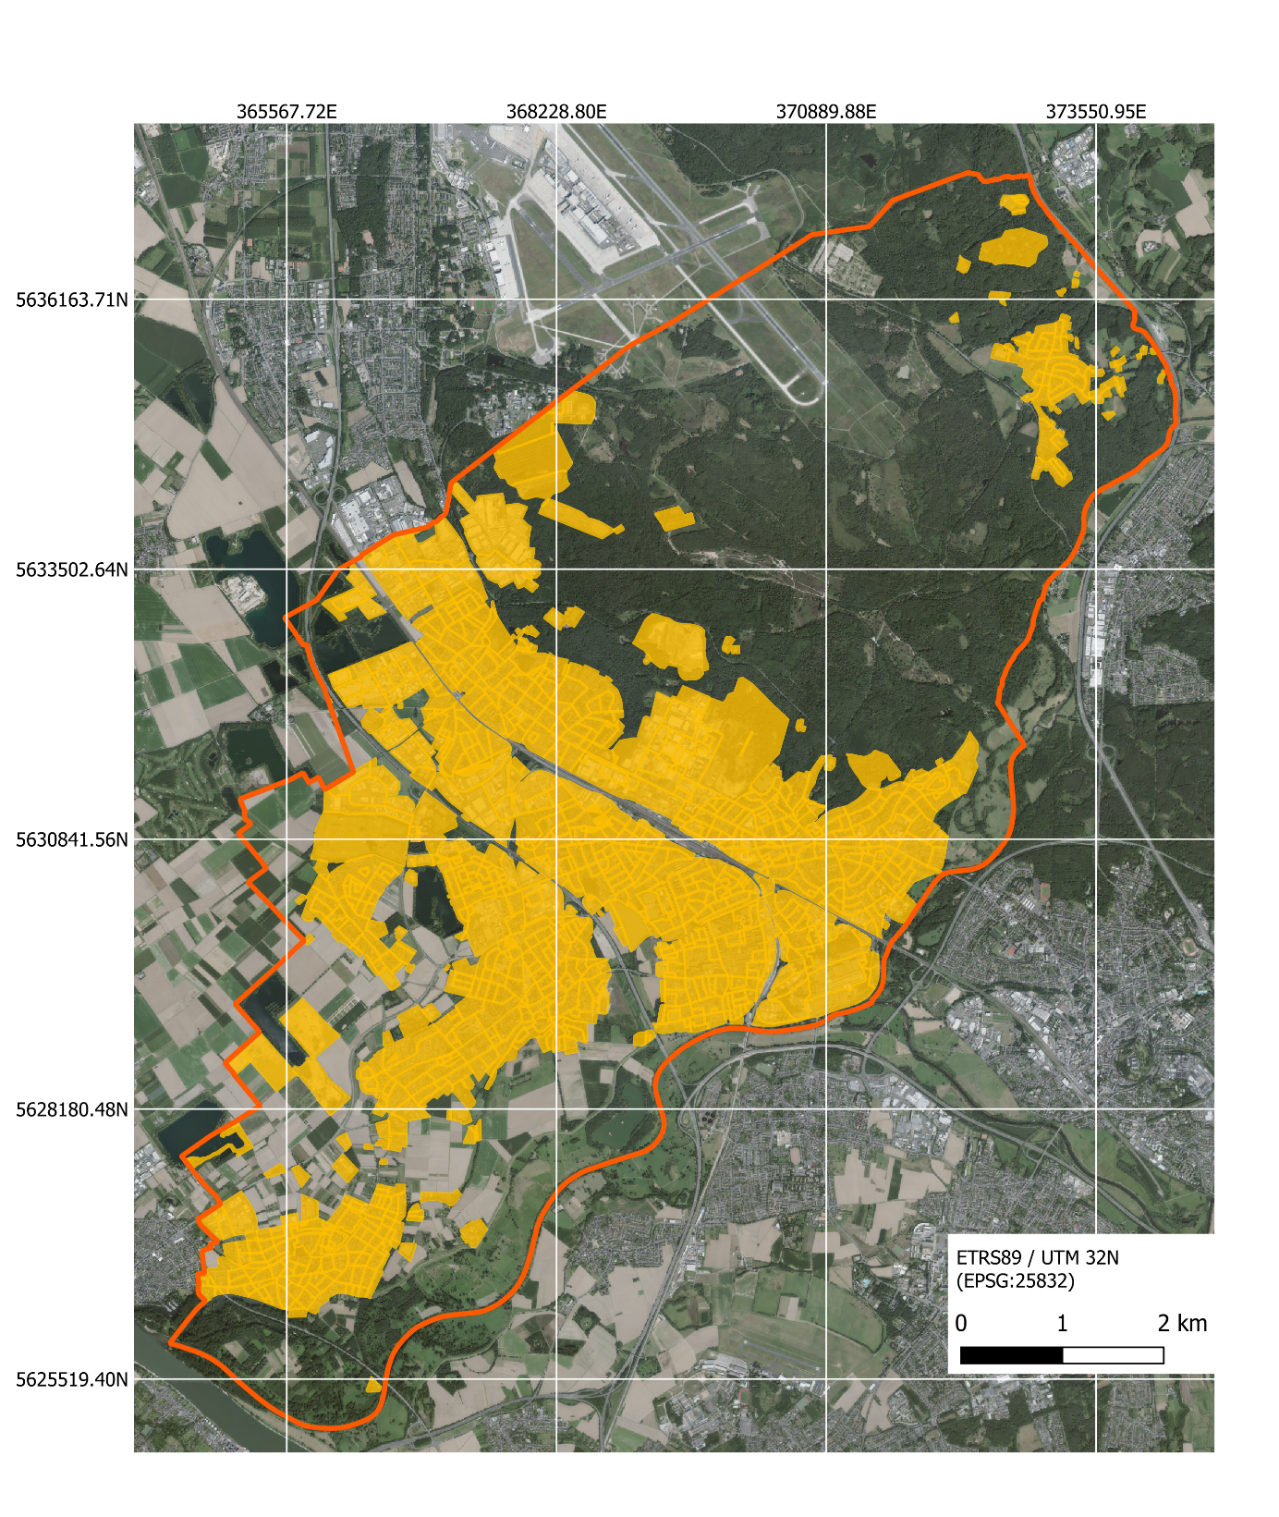
The original study explored this question in Troisdorf, near Cologne and Bonn in Germany. It focused on about 29 km² of settlement areas. Open aerial data made it possible to examine those areas together and connect vegetation across individual property boundaries.
The first step
In an aerial image, we can see patches of vegetation. To describe individual trees, we also need to identify which part of the image belongs to each crown—the leafy canopy visible from above.
The original work trained a deep-learning model, Mask R-CNN, using hand-drawn examples. It traced separate crown outlines across the study areas. Those outlines provided the link between a tree's appearance in the image and its position in the landscape.
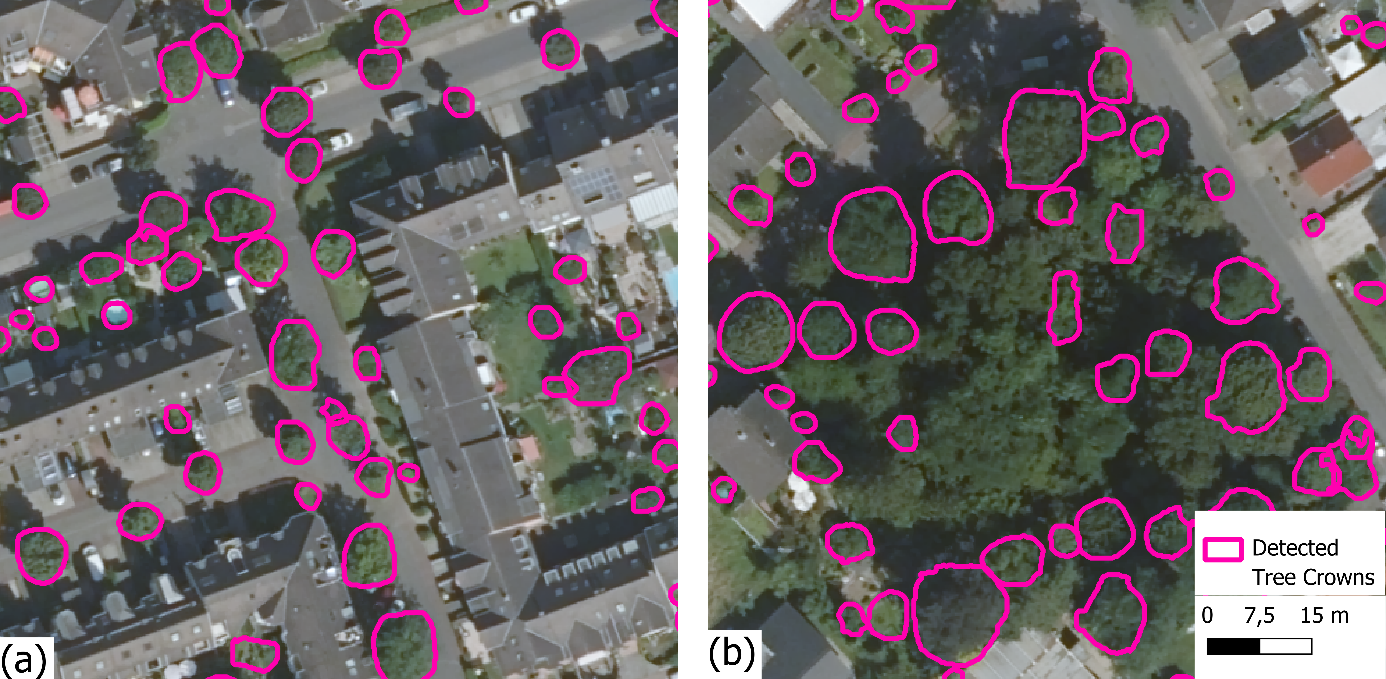
The resulting inventory contained 70,438 detected tree-like vegetation structures. These were automated detections, so the inventory could still include missed, combined or incorrectly identified crowns. It provided a starting point for exploring vegetation structure across the study areas.
Adding the third dimension
A crown outline tells us how much space a tree occupies when viewed from above. It cannot tell us the crown's height or three-dimensional form.
Airborne laser scanning, or LiDAR, supplies measurements at different heights. Using the mapped crown to select the corresponding points allowed the original workflow to estimate height and the space enclosed by the crown. The image and laser data could now be read together.
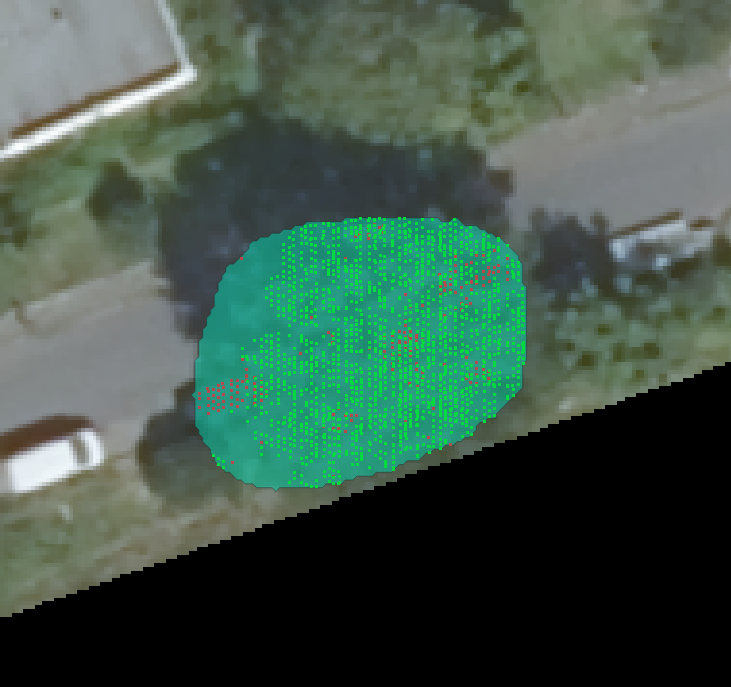
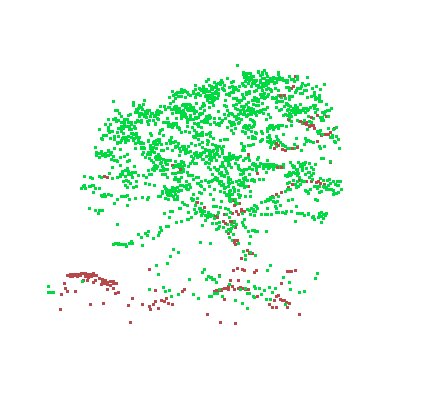
This opened a way to explore differences in crown size across Troisdorf. The volume estimates describe geometric space around measured points; they are exploratory measures of structure, rather than direct measurements of wood or carbon.
The next question
The difficulty visible in the dense canopy remained: neighbouring trees can blend together in an overhead image. If a crown is missed or combined with another, the later analysis cannot describe it separately.
That challenge became the starting point for CATCH4D Upscaling. In the original workflow, height helped describe crowns after they had been detected. We asked whether it could also help the model during detection, when it decides which pixels belong to each crown.
Studies elsewhere had reported different outcomes from combining imagery and height (Lucena et al., 2022; Ruschhaupt et al., 2025). An improvement was plausible, but needed to be tested here. We compared an image-only model with a model that also received a layer highlighting height above nearby surroundings, called relative height.
The two parts of the work now offer complementary views: a way to explore the structure of detected vegetation, and a test of whether height can improve the detection that comes first.
Follow the experiment, or explore the trees and their three-dimensional structure.
The detection experiment
Compare the models, inspect crowns in the aerial images and see how the study measured success.
The vegetation inventory
Rotate example point clouds, explore the map and see how crown height and volume vary across the recorded inventory.
Read the notebook HTML files without installation, or choose Run All in Jupyter to recalculate the analyses. See the README for files and running instructions.
| Person | Contribution |
|---|---|
| Victoria Luise Pissulla master's thesis, Ruhr University Bochum |
Reference crowns, the colour-only (RGB) tree detector, the town-wide detection, the per-tree LiDAR point clouds, the volume method and all crown-volume results |
| Zahra Chehreghan CATCH4D Upscaling, ILS |
The height study, its experiments and GIS package, and this repository and website, including the presentation of the crown-volume work |
| Dr. Shaojuan Xu ILS |
Supervision of CATCH4D Upscaling |
Study-area map, original crown-delineation examples, LiDAR views and alpha-shape figures: Victoria Luise Pissulla. Troisdorf locator map: “Troisdorf in SU.svg” by TUBS, Wikimedia Commons, licensed under CC BY-SA 3.0. Settlement areas were delineated from ATKIS Basis-DLM. Orthophotos, elevation models and airborne LiDAR data: © Geobasis NRW. The crown-distribution map on the volume page displays the recorded crown polygons and evaluation-patch footprints.