What this page shows
The colour-only Mask R-CNN detection model outlined the tree crowns. LiDAR points within each outline were then used to estimate height and volume. This page presents the recorded estimates; it does not calculate new volumes.
Victoria Luise Pissulla’s master’s thesis estimated the height and crown volume of 70,438 detected crowns in Troisdorf’s settlement area. Explore the recorded results below.
The colour-only Mask R-CNN detection model outlined the tree crowns. LiDAR points within each outline were then used to estimate height and volume. This page presents the recorded estimates; it does not calculate new volumes.
The original analysis covered approximately 29 km² of settlement areas in Troisdorf, delineated from ATKIS Basis-DLM. The maps locate the study area and show the distribution of recorded crown footprints. The ten red rectangles are the evaluation patches used for the later height-input detection comparison; they are not the extent of the volume analysis.
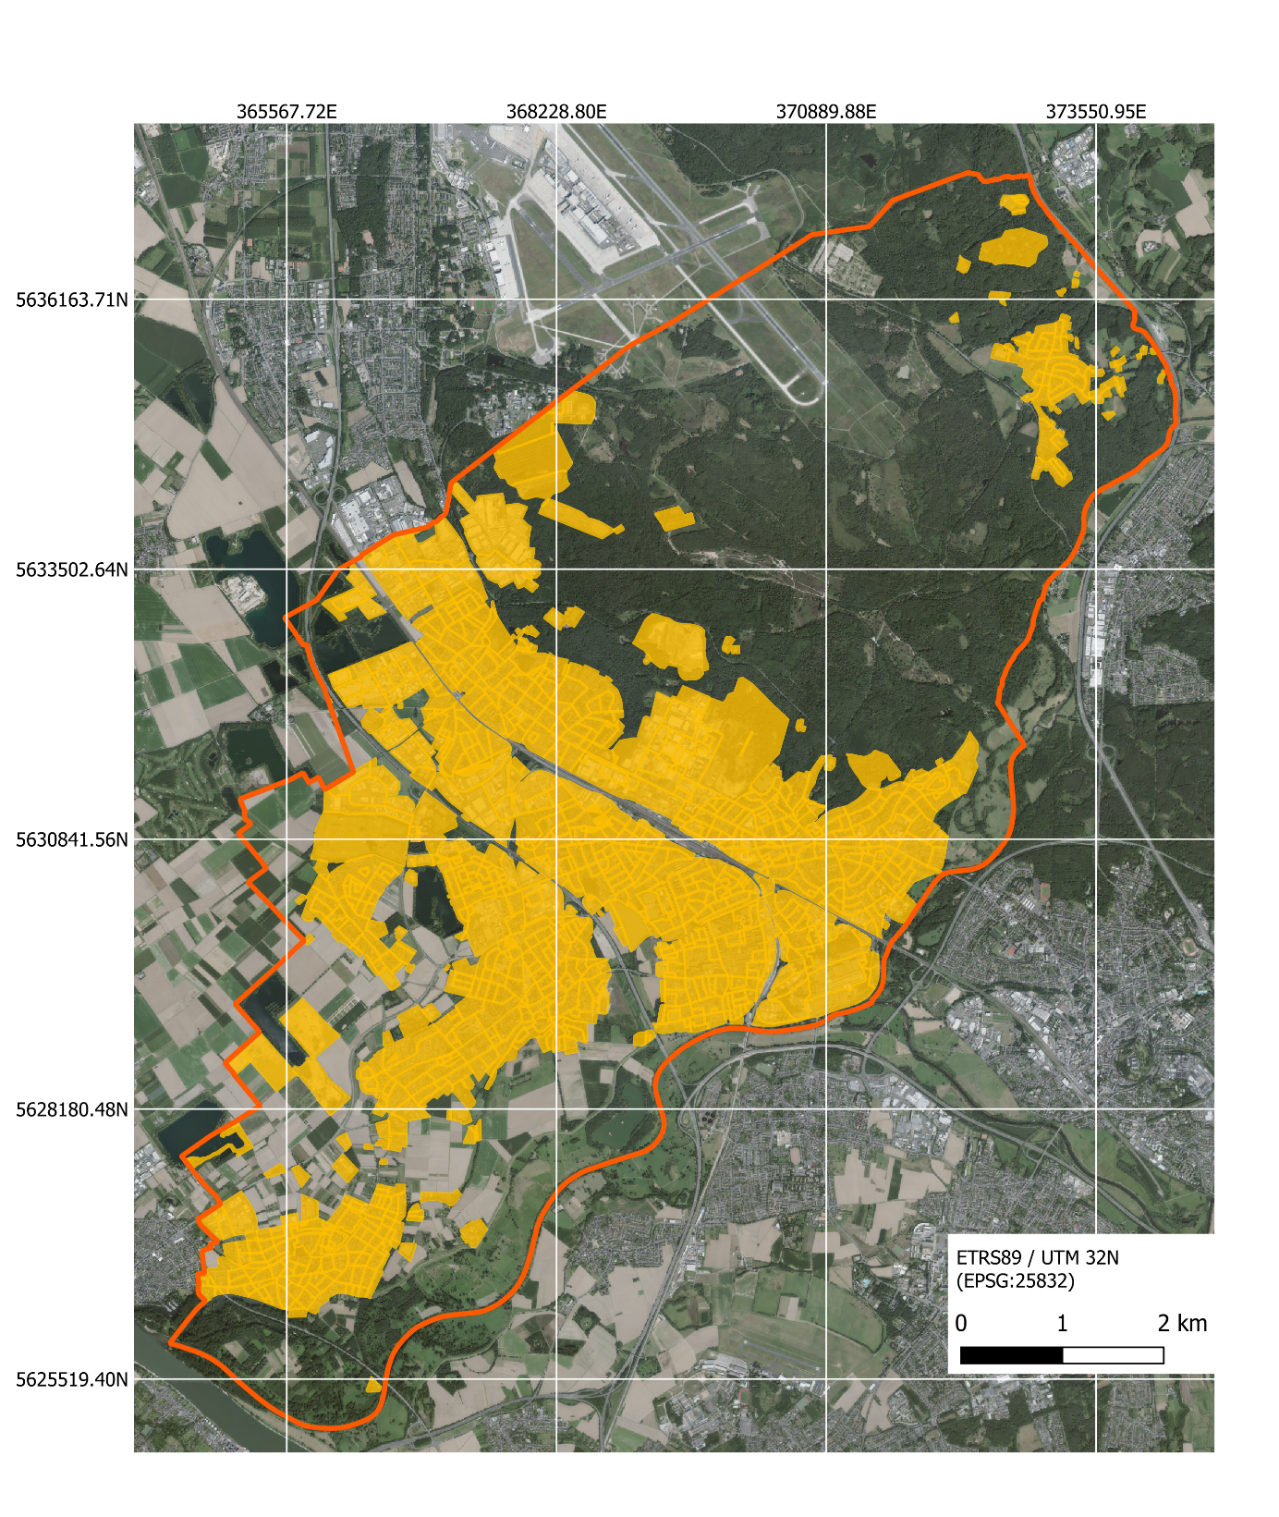
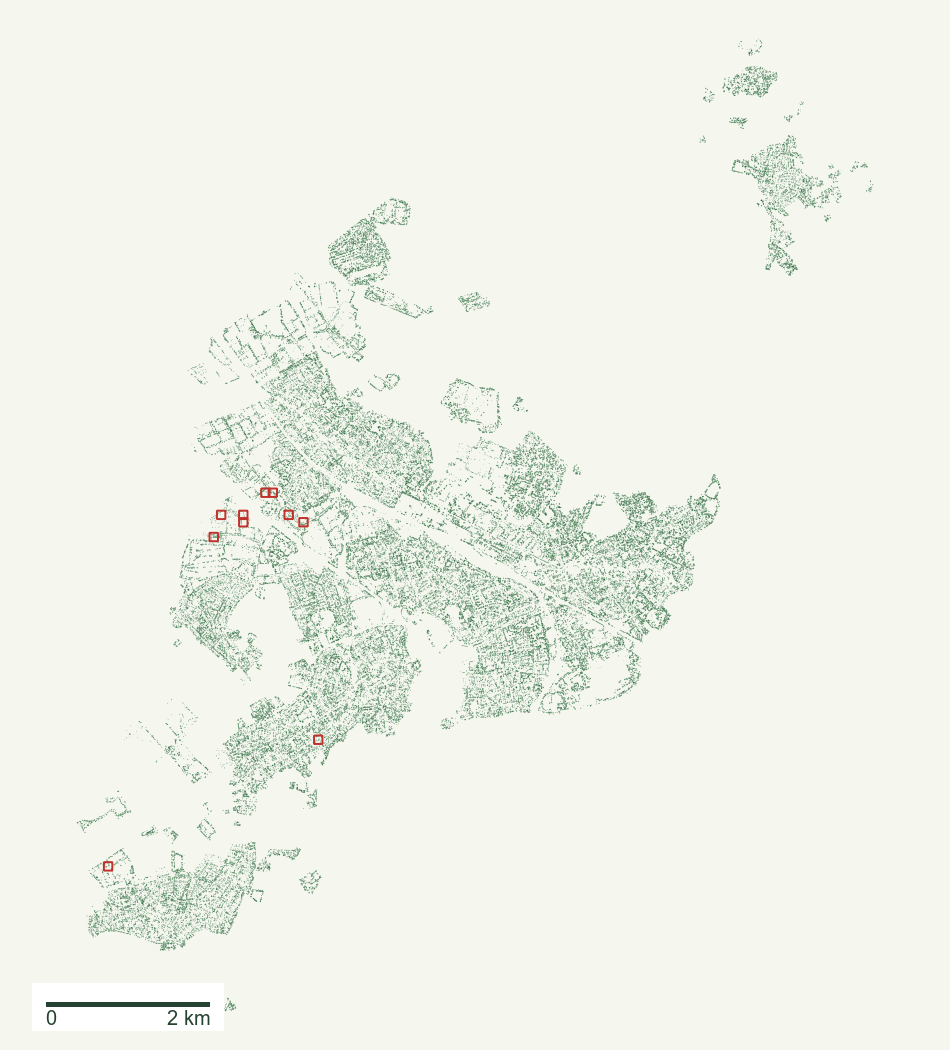
Below, individual point clouds show how a geometric crown envelope was estimated. The later 250 m grid map summarises these same recorded crowns by neighbourhood-sized cells. Detection accuracy was evaluated on the ten test patches; it was not measured for all 70,438 town-wide crowns.
Schematic drawings. The thesis used an alpha shape with α = 0.25. The result is a geometric envelope of the points, not wood volume. The original method is preserved in the thesis notebook.
An alpha shape fits a geometric envelope to selected points. Its form depends on the parameter and the available points. These original examples show why the geometric definition matters when interpreting a volume estimate.
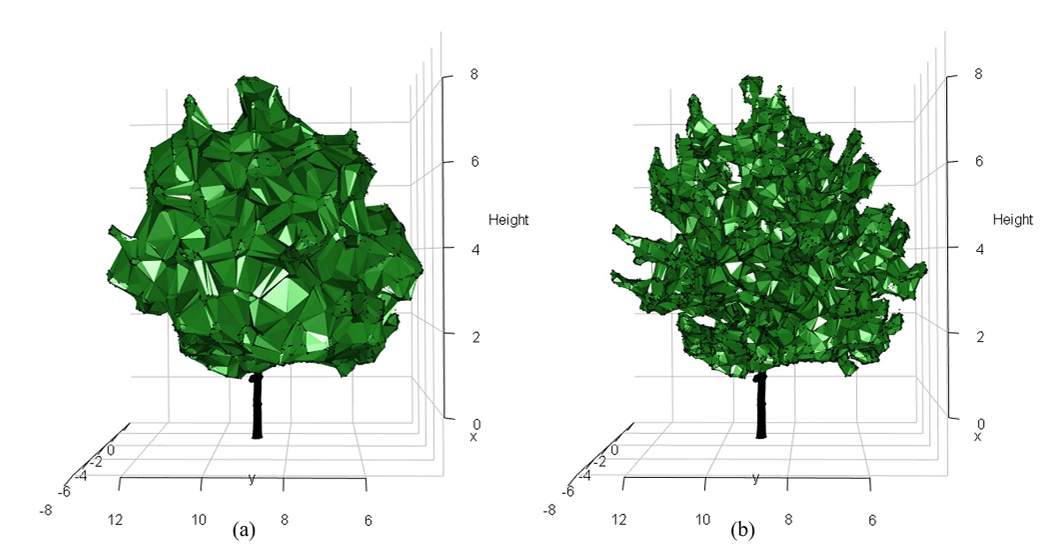
Point density and point selection also affect the result. These illustrations explain the method; they do not validate the volumes against field measurements.
Six of the 70,438 delivered point clouds. Drag to turn the tree; the green line is the crown outline found in the aerial photo, drawn at ground level. Colours show height above the terrain. The values are the recorded thesis results.
Median crown area is about 18 m² and median height 6.4 m. The charts use logarithmic axes so small and large values remain visible.
Larger and taller crowns tend to have larger recorded volumes. Correlation describes this relationship; it does not establish volume accuracy.
Pearson r near 1 indicates a strong positive linear relationship. The notebook recalculates these values.
Each square below is a 250 m × 250 m aggregation cell, not an image pixel or an individual tree. Its colour summarises the recorded crowns whose locations fall in that cell: count, median crown volume, or median height. Hover over a cell for its values. Red rectangles locate the ten detection evaluation patches shown in the overview above. Uncoloured space is not evidence that there are no trees there.
Each grid cell represents 6.25 hectares. The colours describe recorded crown counts or median estimates within a cell. The grid provides a two-dimensional geographic summary of the three-dimensional crown analysis. The red outlines locate the ten small detection evaluation patches.
The register is a comparison source, not exact ground truth. Its crown areas are derived from diameters; observations have different dates, and several registered trees can match one merged crown. Only aggregate values are shown.
For geographic inspection, open the QGIS project and select 08_Whole_Settlement_Crown_Volume. See the GIS guide.